
All that gobbledygook
- Tiago Figueiredo

- Nov 25, 2019
- 9 min read
Updated: Dec 10, 2019
Summary
Market dynamics — Is the purge in duration over?
Financial conditions — Taking drug addicts off of drugs is hard.
The week ahead — Nothing but trade.
The macro narrative continues to revolve around good vibes with the tariff relief and central bank stimulus being the key pillars keeping the expansion alive. Markets were fairly sloppy this week as investors struggled to come to grips with the conflicting news flow surrounding the progress on trade talks between the US and China. Many market participants still view a phase one trade deal as their base case scenario given that it is in the interest of both the US and China to squash any further escalations. However, some participants are starting to hedge downside risk, worrying that President Trump may throw caution to the wind and unwind the deal altogether. Adding to the worries, Congress passed a bill in support of Hong Kong protestors (requiring more scrutiny on whether HK has kept its autonomy) which will undoubtedly infuriate Beijing if the bill gets put into law. President Trump now has the option of either angering China or Congress — Remember this comes off of the back of his misstep in Syria a few weeks ago. In more positive news, China issued some guidelines aimed at strengthening intellectual property rights which have been one of the key sticking points in negotiations. At this point, nobody believes that the two nations will agree to the sweeping deal that was originally advertised. The latest guidelines may be a step in the right direction but after skimming through the document, one has to wonder how much of it will get done — the guidelines are fairly ambitious. Despite my skepticism, markets will undoubtedly take this in stride. The recent momentum from Pete Buttigieg following last week's Democratic debate has also been providing support to the equity rally given that market participants are scared to death by Elizabeth Warren’s policies. Economic data in the US came in mixed but better than expected on the margin. In Europe, the story was much more of the same with a feeble bounce in factory orders in Germany while manufacturing data remained in contraction. Despite the nascent reflationary story from trade optimism, inflation has remained subdued. The reality is that the global economy is in no shape to support higher interest rates. Indeed, market participants have been rotating to more pro-cyclical equities following the rise in yields, however, this doesn’t seem sustainable. To try to quantify some of this rotation (and to showcase some more technical work), I am going to introduce a simple momentum based trading strategy that rotates through different sectors in the S&P500. The model will buy the top-performing sectors and has the option to hold cash. The target volatility of the portfolio is 10 percent and the model will allocate funds to cash if the historical volatility exceeds that threshold. The chart below shows the relative performance of this strategy to the broader S&P500 index as well as the daily returns and drawdown.

The point of this model is not to show that it outperforms the market (it doesn’t) but rather to estimate the positioning of market participants. As such, the chart the matters most to us will be a time series of the model's asset allocations to cash, cyclical and defensive stocks. We can see that for November, exposure to cyclical stocks has increased, consistent with what we are seeing in the market. However, we can see the model also allocated more of its holdings to cash and continues to hold defensive stocks.

The real question going forward is whether the rotation into cyclical assets has more to give. This brings us to an interesting dynamic as things can go two ways (broadly speaking). If growth remains sluggish, then inflation remains subdued and the case for higher interest rates has no leg to stand on. In that case, bond proxies will likely do well and cyclical assets (along with value) will once again be left behind. Lower growth and inflation prospects will bolster hopes of continued central bank easing and push forward the narrative of TINA (there is no alternative). In this world, risk assets move higher as investors continue to be pushed down the quality ladder and equities get a boost from lower discount rates. On the other side, growth could start bottoming and the monumental amount of easing from central banks could start to work its way into the economic data. In that case, we could see an inflection in manufacturing and FOMO (fear of missing out) starts to take over, bringing riskier assets higher given the record low hedge fund exposure to the S&P500. That would imply another reflationary trade where cyclical assets start to outperform and would likely result in an even further unwind in the duration trade which has taken place for the better part of the year. For what it’s worth, I don’t see that happening any time soon. According to Nomura and Bank of America, the CTA’s (momentum trading hedge funds) are likely done with their duration unwinds and are likely now neutral bonds. It would take another large rally in yields to force these funds to go short. With that in mind, I think the biggest event in the coming weeks will be the phase one trade deal. Particularly, whether President Trump plans to go ahead with the planned December 15th tariff escalation. There’s no question that the recent rally in stocks hinges on this and it will put a big damper on sentiment if it doesn’t go through. If it does, then all eyes will turn to the challenges of finessing a phase two deal as well as the incoming macro data to see if central bank accommodation has worked its way through the system. Another potential risk going into month-end will be pension fund rebalancing, given the large rally we’ve seen in equities this month. As things stand right now, over 90 percent of global assets will post gains in 2019, clearly juxtaposing 2018, where cash outperformed almost everything. I think now would be a good time to try to bring everything full circle and make sense of all that gobbledygook relating to gamma hedging that I keep barking on about. I’m not going to pretend like this stuff is easy to understand, it’s not. Heck, I barely get it. The little that I do understand took time to marinate. I had to read about it several times before it started to stick. This week, I’m going to take a bird's eye view of financial markets and the economy and try to relate all this jargon to the everyday person. As for you propellor heads, there’s going to be stuff in here for you too — don’t worry. Let’s start with the 2 main factors the made 2018 such a dumpster fire. Central bankers learned a hard lesson last year — it ain’t easy taking drugs away from drug addicts. The market was addicted to easy monetary policy — interest rates were low and the central bank had spent the last several years supporting the bond market. The Fed was essentially that whale of a customer that walks into the store and buys everything you’ve got regardless of the price. When Jerome Powell started his push for policy normalization, not only was that whale not coming to buy your bonds anymore, the price of the bonds you were selling was also falling. Why would he do that? Well, the argument here was that stability was breeding instability by allowing market participants to flirt with riskier products knowing the Fed would always come to the rescue. For lack of a better term, this was a way to “purge” the system so to speak. Many market participants liked that approach, myself included, but it was too far, too fast. The market had been sedated for years, allowing geopolitical uncertainty to rise, and the market was simply not prepared for such a brute force approach. At the time, market participants were grappling with uncertainty regarding trade policy and domestic issues tied to the government shutdown. The market might have been able to handle those 2 separately had they felt the Fed was on their side. However, when you throw in monetary policy pushing its limits on how much it can tighten policy and you have a recipe for disaster. The main mechanism through which we capture the effects of monetary policy is through financial conditions. You can think of financial conditions as being the link between financial markets and the economy. Financial conditions typically look at 5 different types of financial assets: stock prices, government bond yields, the spread of corporate bonds to government bond yields, overnight lending rates and currency. These 5 types of assets all move together in different ways depending on the economic environment and its important to understand both the individual impacts of each one but also the cumulative impact of all 5. For example, higher equity prices mean that people have more wealth if they are invested in the stock market but, if higher stock prices are accompanied by higher interest rates, people in the economy are not able to borrow as much and these two effects may offset each other. Financial conditions began to tighten rapidly in Q4 2018 because the market feared the Fed was making a policy mistake. This lower growth and inflation expectations while bond yields were rising due to a hawkish Fed. All of the micro factors that I have been barking on about in this newsletter (i.e. gamma hedging, CTA deleveraging and a lack of liquidity in the market) just poured gasoline on the fire. The chart below shows a time series of a financial conditions index (a weighted average of the 5 asset types I listed above) for the US that I have made.

These indexes are used to try to get an aggregate measure of financial conditions rather than looking at the individual pieces. For this index, a large value means that financial conditions are tighter, which is bad for economic growth. The average of the index is equal to 100 and anything greater than 100 is considered to be tighter relative to the historical average. We can see that Q4 2018 (the red circle) pales in comparison to 2008. That’s a good thing considering people in 2008 thought the world was going to end. Interestingly, when we look at the distribution of quarterly changes in financial conditions we can see that Q4 2018 was far worse than the graph would suggest. The chart below shows a histogram along with a density function for the distribution.

Apart from the financial crisis, we can see that the quarterly change in financial conditions was one of the largest since 1997 (when the index first starts). A lot of that has to do with the fact that dealers had negative gamma. As a reminder, this means that dealer hedging flows were going with the market, which would make any sell-off worse. CTAs were also unwinding positions during this period, making matters even worse. It also didn't help that the market wasn't liquid given that it was going into the end of the year. The chart below shows the relationship between dealer gamma and changes in financial conditions.
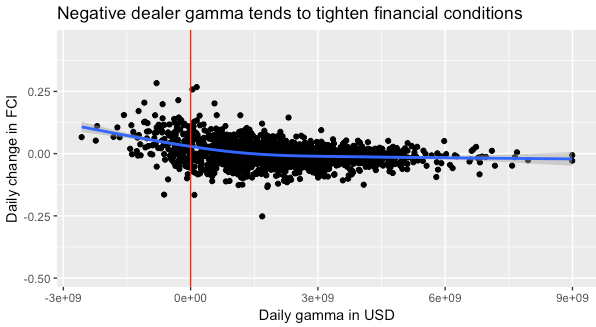
We can see that when dealer gamma flips negative, financial conditions tend to tighten more. Now to bring this back to the aggregates like GDP and employment. I did a quick little experiment to see what would happen to economic growth and employment in the US if we shocked this financial conditions index by 50 bps (half of what we witnessed in Q4 2018). The panel below shows an estimate of what would happen to GDP (green line) and employment (blue) following the shock in financial conditions out 10 quarters. Note that the dotted lines represent the 95% confidence interval for all the stats guys who are interested.

What matters here isn’t the actual number but rather the direction (the numbers are almost surely wrong — my model is too simple). What this tells us is that shocks to financial conditions hamper growth and that these shocks can be amplified by all these micro dynamics that happen beneath the surface. Although the majority of retail investors will probably never need to understand these dynamics, I want you folks to know that all these dynamics do matter. The critical take away from all this is that this is a new "feature" of modern market structure that we're going to have to deal with going forward. With central banks facing this "ammo problem" of not having enough room to lower rates, these desperate pushes to raise interest rates may happen more often. That means that these ugly dynamics may begin to rear their heads more times than we’d like to see them.
The market will be in wait and see mode this week as investors try to digest the latest news flow. On the data front, we have a fairly busy week in the US with the second estimate of US GDP being released and along with personal income and inflation data. Canada will also publish GDP figures and the Bank of Mexico will release their meeting minutes. In Europe, we will be getting an update on the German consumers and business confidence along with a slew of other macro data for the bloc. In the far east, we will get an update on Chinese manufacturing along with a monetary policy meeting for the Bank of Korea. The Bank of Korea is expected to remain on hold. The lopsided results of the local elections in Hong Kong will continue to put pressure on China to find a solution to the protests. Ultimately, the only thing that matters for markets in the near term will be the completion of the skinny deal between the US and China.
Tiago Figueiredo


Comments