
Throwing a wrench at the Fama-French
- Tiago Figueiredo

- Oct 2, 2021
- 6 min read
Who's looking for common risk factors?
Over the past several weeks, I've taken time to break down some propellor head concepts relating to how investors manage their risk exposures. In particular, the focus has been around factor investing. In Welcome to the jungle, I laid out a brief introduction to the world of factor investing, while in Rising like a pigeon from the ashes I honed in on the oldest factor model in the world of finance -- the CAPM. These posts have set us up neatly for today's post on multi-factor modeling, notably the Fama-French series of factor models. I recommend that readers refer back to the two posts linked above before continuing any further, as I take some liberties in this post on the assumption that readers are familiar with the topics in the previous installments.
In previous posts, we calculated a company's Beta, or measure of systematic risk, to show that company's with higher estimates of systematic risk tended to be more volatile. Unfortunately, we also showed that the CAPM model had lost most of its ability to predict stock returns over the past decade and a half. Now that shouldn't come as a surprise, the CAPM is nearly over 60 years old, and financial markets are complicated and constantly changing. To help address some of this complexity, we introduce a series of models from Eugene Fama and Kenneth French this week. It's easy to get lost with all the inside baseball, but remember that all we're trying to do is find drivers of asset returns. In that respect, it's reasonable to think that just looking at how the market performed will not be enough to explain variation in all stocks, and that is where the multi-factor model comes in. To be upfront with this, the results from these models aren't much better than the ones we saw with the CAPM. However, the process and ideas behind the Fama French series of models are something we will leverage in coming posts and can still be used to this day to identify portfolio risks, albeit better models exist now.
The market is up, but my stonks are down?
The Fama French factor models extend the CAPM model by regressing returns on the market and two factors for firm size and value. The market factor is the same as the CAPM model, meaning that you are just looking at the returns of a portfolio consisting of the broader market-cap-weighted market. The size factor comprises a long-short portfolio that holds a long position in small-cap companies and a short position in large-cap companies. The theory goes that smaller companies command a higher risk premium since they are less established and have a higher probability of failing relative to larger companies. Meanwhile, the value factor looks at the ratio of the book value of the company and the market value. Here, companies with a higher book-to-market ratio signal that their shares have been oversold since their market values are less than their book values. To put it simply, the book-to-market ratio is just an indication of the "cheapness" of a company. So the value factor buys cheaper companies and sells expensive ones, looking to capture the premium from the higher risk of buying companies the market thinks are not doing well and could be in financial distress.
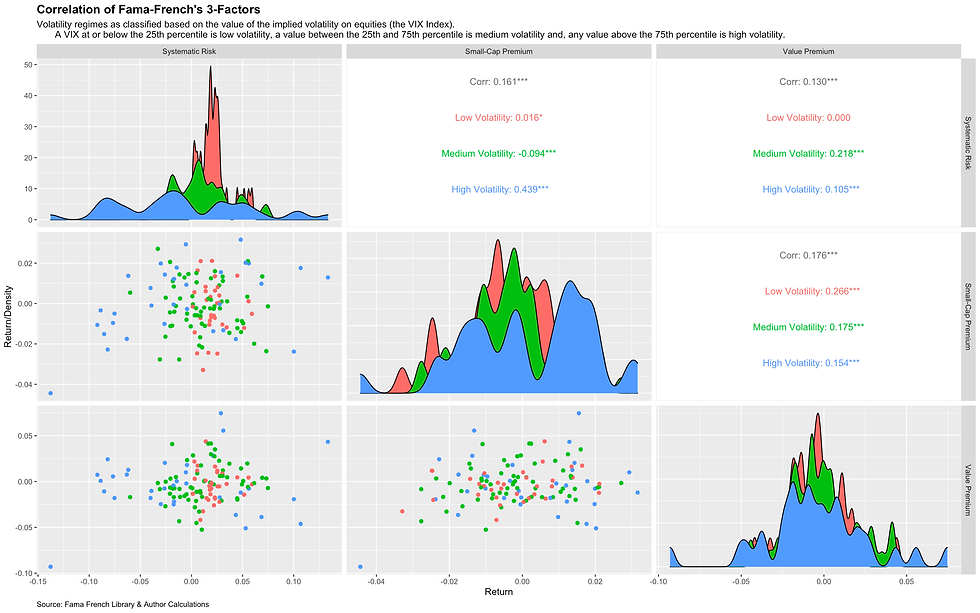
The Fama-French factor model is something heavy brains call a multi-factor model. This type of model is very similar to the single-factor model. It is estimated using a regression model; however, there are some restrictions since more variables exist. The most notable and often leads to issues in estimation is the effect of multi-collinearity. In plain English, multi-collinearity means that at least 2 of the factors in the model are significantly correlated, meaning that the addition of the extra factor has no additional value in explaining changes in the model. One example would be running a multi-factor model with a factor for the market and another factor that is just the short market portfolio. In this case, the two factors are perfectly (or almost perfect when you factor in borrowing costs) negatively correlated to each other and would not add any additional predictive/explanatory power in the model. In theory, this makes sense, but in practice, it can be tough to find uncorrelated factors across time, particularly during periods of crisis. Fortunately, Fama-French's original 3-factors are all relatively uncorrelated, as shown in the chart below, and, more surprisingly, the correlation is relatively stable across volatility regimes (apart from the small-cap premium).
Much like we did in the CAPM, the output of the Fama French model tells us how sensitive each asset is to the market, small-cap, and value portfolios. However, interpreting the results of the 3-factor model is a bit different from that of the single-factor model because there are more moving pieces. For example, the chart below shows the output of the Fama-French 3-factor model for three companies in the S&P500, Kellogs, Apple, and Lincoln National. I picked these three companies because they show differences across the three factors. In addition, the chart sorts the companies from lowest systematic risk (Beta) to highest. The dots on the graph show the point estimate, while the bars show those estimates' 95% confidence interval.

The red line shows the calculation of systematic risk, and the interpretation is the same as the one of the CAPM. The blue line shows each company's exposure to the small-cap portfolio. A positive number here indicates that the stock's returns positively correlate to small-cap exposure, while a negative estimate suggests that the company trades more with a large-cap exposure. Unsurprisingly, we can see that Kellogs and Apple trade more like large-cap companies than small-cap companies, while Lincoln National is changing more like a smaller-cap portfolio. The green line represents the value premium and positive number indicators that the market has oversold the company relative to fundamentals. A negative number indicates that the market is pricing in a growth premium, and the market has overbought the company compared to fundamentals. Here we can see that Lincoln National trades like the value portfolio in the Fama-French factor model, which makes sense since it has sold off nearly 30 percent since 2020 and sold off as much as 70 percent during the heat of the pandemic last year.
Can the Fama-French dodge a wrench?
As I had alluded to earlier in the post, the Fama-French model is not what it used to be. Models and frameworks fall out of style in financial markets faster than I would if I lived in Tribeca. Fama-French is no exception. The value factor has mainly gone under fire over the past decade for plenty of reasons. The most compelling is that companies with intangible assets tend to be labeled as growth companies since their book values do not capture their total value.
Nonetheless, the explanatory power of the Fama-French series of models has not been great over the past decade. As some of you might have noticed, I have used the Fama-French "series" to suggest more than one model. In reality, I have tinkered with four different ones, all of which offer the same insights that none do a great job of explaining stock returns. The chart below shows the Fama-French 3-factor, 5-factor (which includes a factor for quality and profitability), 6-factor (which extends the 5-factor model by adding a momentum factor), and the 5-factor model with a twist from AQR (for more information, please click here).
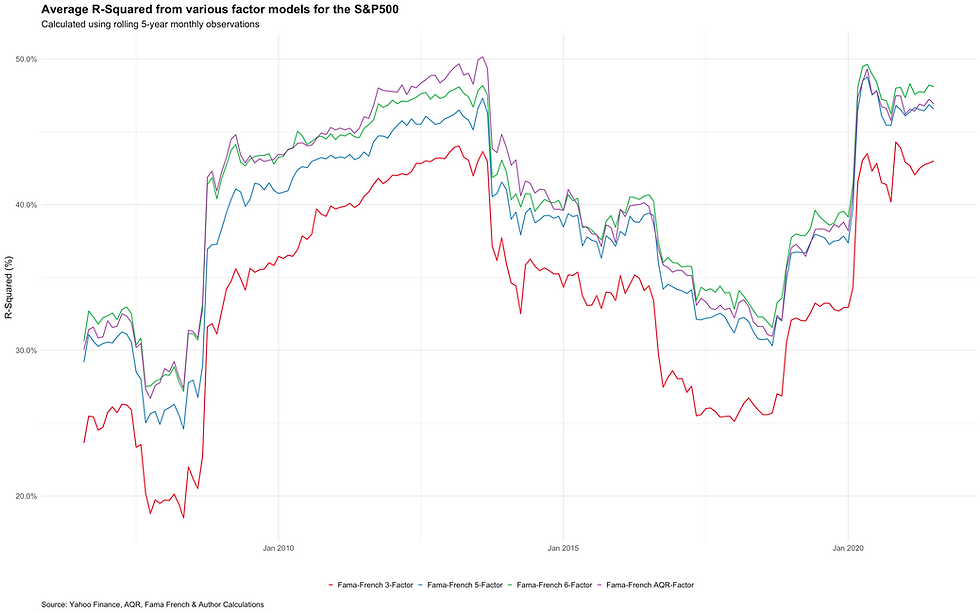
In this chart, we're plotting the average explanatory power of the Fama-French models across the S&P500 over 15 years. We can see that the explanatory power varies across time, but for the most part, it stays below 50 percent, which is not that great. Although the explanatory power has improved over the past year, as we showed in Like a pigeon rising from the ashes, most of that increase is attributed to increasing systematic risk, a common factor across all models.
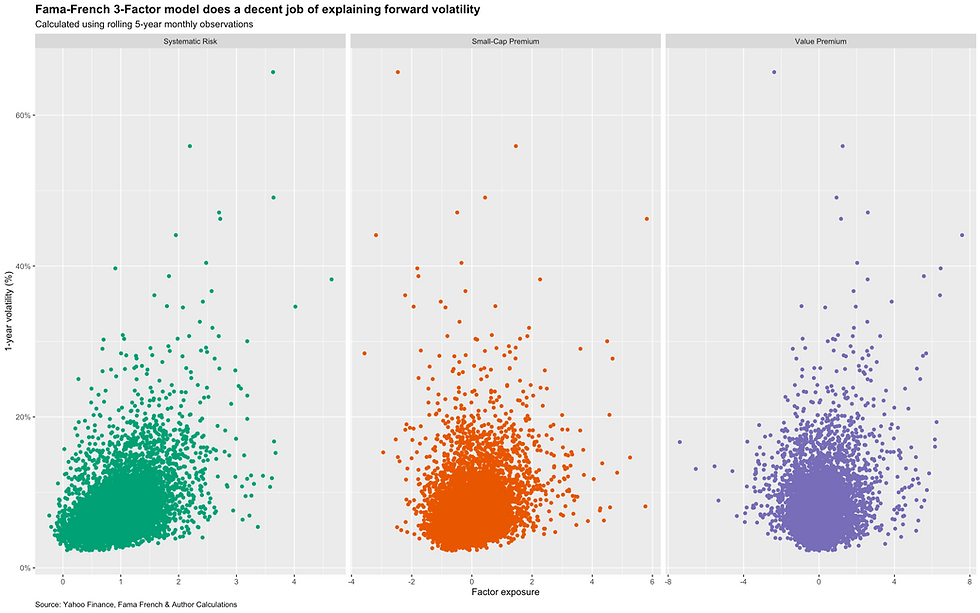
Despite the criticisms regarding the Fama-French models, like the CAPM, the model does a decent job predicting return volatility. The chart below shows the average 1-year volatility based on a company's factor exposures in the Fama-French model. We can see that, for the most part, companies with higher measures of systematic risk, small-cap risk, and value exposure tend to have higher volatility in their returns.
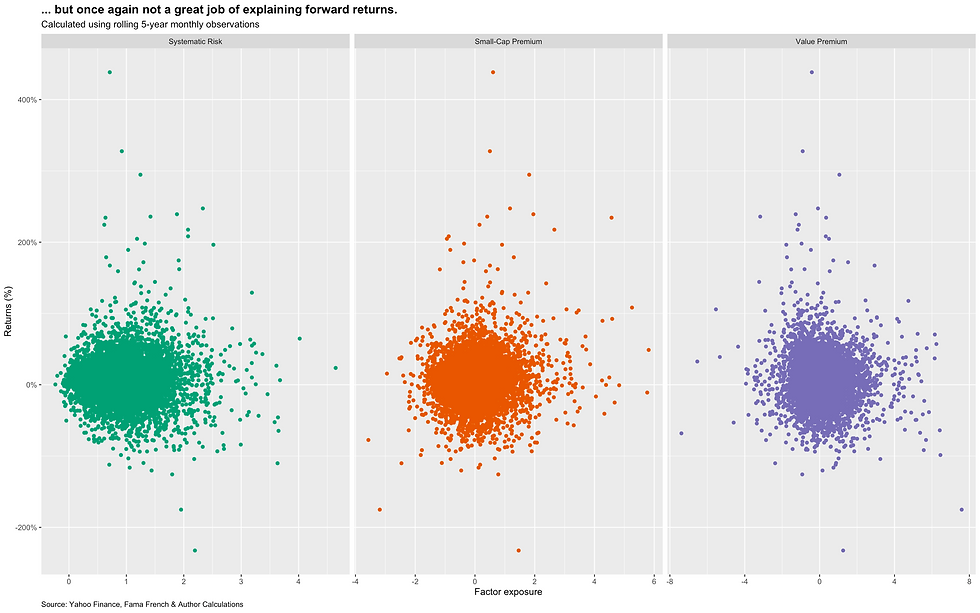
As for returns, as expected, the Fama-French 3-factor model does not do a great job of explaining forward returns. However, we can see that the small-cap premium seems to be the best predictor of the three factors.
Constructing portfolio's using the Fama-French Factors
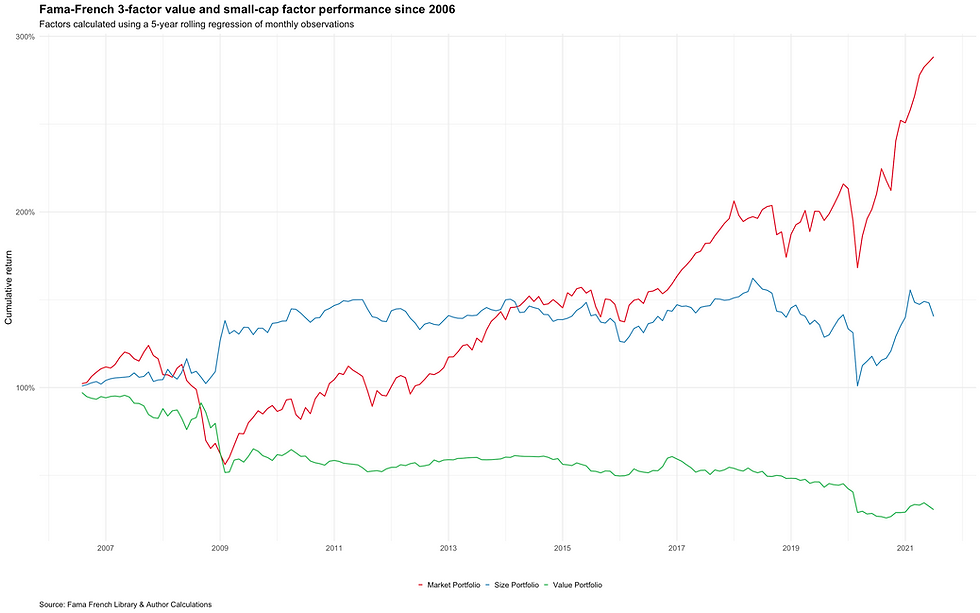
Of course, we can use the Fama-French model to construct portfolios that have exposure to the different factors. Here, for simplicity's sake, we take a portfolio that longs the top quantile and shorts the bottom quantile of stocks with a given factor exposure within the S&P500. Here we only construct equally weighted portfolios for the small-cap and value premium. The chart below shows the performance of these portfolios since the data started back in 2006. We can see that small-cap has a positive return over the period while the value portfolio has had a negative return. These findings align with what we've seen in the market over the past decade, where growth companies have vastly outperformed value companies. Unfortunately, neither portfolio outperforms the market over the period.
With that said, this does not make these portfolios useless. On the contrary, although we didn't construct a portfolio that outperformed the market, the process we just took is critical for portfolio construction and risk premium investing more broadly. In the coming posts, we will talk about how we can boost returns through the use of leverage and alternative to weighting assets in the portfolio.
Thanks for reading, and reach out if you have any questions.
Tiago Figueiredo


Comments